If you don’t program yourself, life will program you!
—Les Brown
Every product owner’s everyday concern is how they can build a connection with their audience, how they can understand the audience better and satisfy all their audience’s expectations and needs.
And it’s even more of a struggle for a budding entrepreneur who is yet to learn a lot about the growing market, or has financial limitations or distance teamwork,for them growth and wealth could be an uphill battle.
Which is why, It is important to plan things out before life starts planning for you.
We have jotted down a list of 5 most efficient analytics tools that will help a product owner plan things better.
A product owner can lean on to these five saviors known as analytics tools.
They are reliable, they are accessible, and they are made keeping in mind just what an entrepreneur would need with time as he grows.
In this article, we’ll cover the top five analytics tools that can help a product owner examine his growth, find hurdles, and come up with strategies to conquer them.
The tools we’ll cover in this article are:
- Google Analytics
- Upsight
- Mixpanel
- WebTrends
- Adobe Analytics
How do these analytics tools work?
The technology is rapidly changing; users are now shifting to mobile applications rather than sticking to web applications, I am not saying that you should just focus on mobile apps. Concentrating on each aspect is essential.
After you have created your application and you redirect your users to your sites, it is essential to determine how productive the redirection has been.
A product owner must know the line of events that happen after her/his users actually start using the application.
If you know all such events, you will be able to strategize better as to what changes are needed or what upgrades you can introduce to make your application, even more, user friendly.
This is where analytics tools come into play.
These analytics tools provide you with data such as the location of your users, applications, and services your users prefer or use, number of times your users visit the sites, feedback about your website, and how many users utilize your application.
Once you have relevant information about all these parameters, you would be able to know where your application is lacking and what solutions you should implement to enhance the working of the application. And all this is possible with the help of analytics tools.
So let’s take a look at which analytics tool you can choose and rely on:
Google Analytics
Google Analytics is a web analytics tool that is a must-have for every website owner. This tool allows the owner to track an extensive range of data from site performance, the traffic on your web app, to even the user behavior.
You just need a google account to get started with this, it is free of cost, and it can totally transform your marketing strategy.
Google Analytics is compatible with both android as well as iOS, and the owner can integrate a lot of features using Google Play store.
Google Analytics offers a cluster of information regarding the traffic that arrives at your website. This information is generated keeping as base the audience, the acquisition, the behavior and the conversions that are carried out in your website.
This tool can help you obtain information on these major areas:
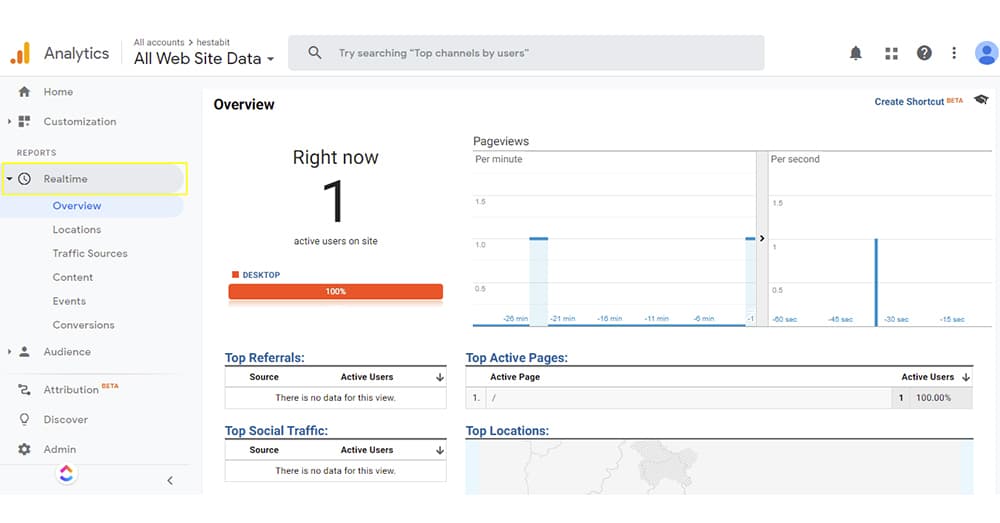
- Real-Time Data:
The owner can obtain real-time data using Google Analytics. The data generated will show information about the traffic on your site and the geographic location of the traffic.
- Audience:
Google Analytics can collect data that will help you determine how many new users are landing on your page, and how many are returning, the geographical location of your users, and the demographics (age and gender).
It can also help you determine the user flow in two categories:
Affinity Category, which is used to connect to potential customers, so they become aware of your brand and In-market Segment in which users are ready to purchase the product or services in a specific category.
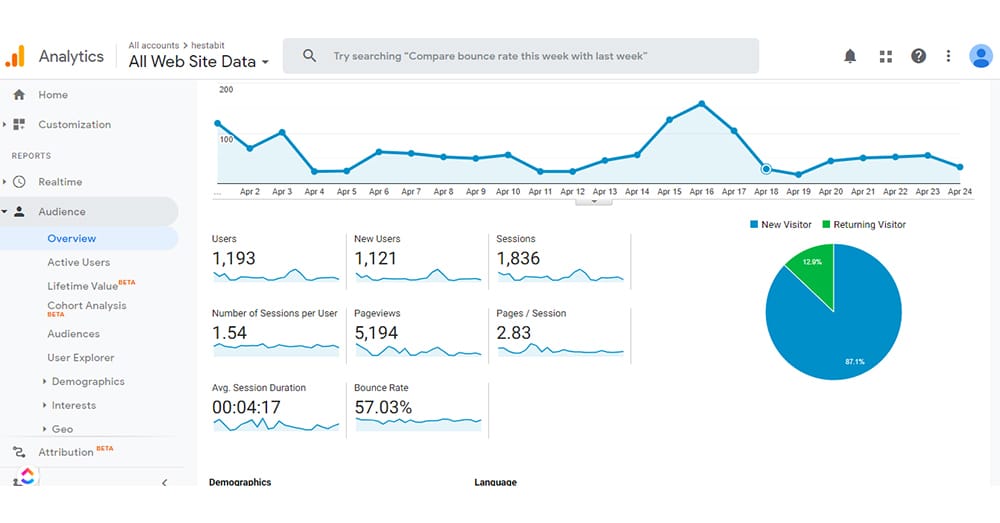
- Acquisition:
It will provide you with data about where exactly the traffic is coming from on your page.
It could come from five major areas, namely, Referral (user who come to your domain from other sites), Direct (directly by searching domain name), Paid (the paid campaigns you might have run), Organic (through keywords or google search), and Social (through social media channels).
- User Behavior:
Using this, you can determine how much time a user spends on a page, how s/he navigates to the other page and at what page your user drops off.
If a particular page is causing the drop off frequently, you can work on refining it and fixing the problem.
- Conversion:
Google analytics provides the product owner with information regarding the conversions that took place at your site.
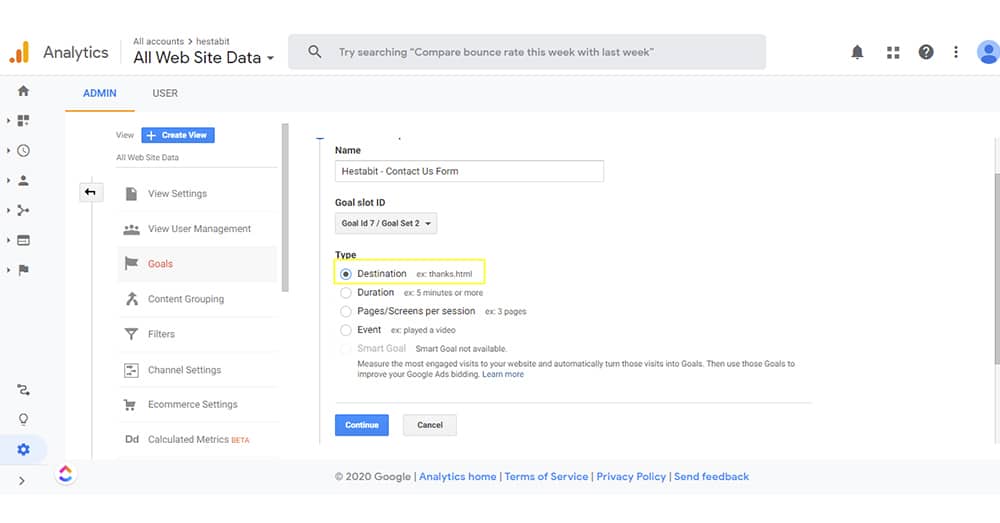
For example, you have set up “filling a form” in the ‘destination’ as a goal and if ten users visit your site and one fills the form, that one would be a conversion.
Google Analytics also offer features like:
Smart Goals: if your ads don’t have enough conversions you can use an automated bidding tool provided by Google Analytics. When you enable the smart goals, google analytics will assign scores to your websites’ or apps’ visits, with the ‘best’ being translated into smart goals.
Funnel: Google Analytics lets you specify the path your traffic would take, this path is called Funnel. Analytics can record when users enter and exit this path, this information can be used to track user movement. Which you can analyse and use to impact your future goal.
Let’s understand all of this in a better way through a real-time example:
Let’s suppose you run an online store, now if you need to cater to your users better you have to understand their needs.
This is where google analytics plays a significant role. Using the tool, you can collect data on almost everything(Traffic Source, Location, Behaviour, Device, Browser, etc). You can learn about the geographical location of your users and then use that information to your advantage.
For instance, you will not sell sweaters to people living in Australia, if you know that users visiting your website are majorly from Australia, you will set your store according to them.
You can also figure out which device and browser your users are using and enhance your website for that particular browser and device.
Using goals and funnels, you can even track your user journey from start to end.
All in all, you can mold your website according to your users, giving them the feeling that you know them better than they know themselves.
3,715,297 companies use Google Analytics in their tech stack, some most famous ones are: Airbnb, Uber, Spotify, Google, Slack, lyft and Dropbox.
Upsight
Upsight is a combined product of two app analytics companies, namely, PlayHaven and Kontagent.
The tool helps in comprehension of user segments, funnel analysis, unlimited data storage, and in-application marketing. It also provides the product owner with information about revenue metrics, core acquisition, and engagement.
This tool is widely used to understand user behavior, retention, and monetization campaigns.
Funnel analysis gives the owner an edge in improving his application’s performance.
This tool provides the owner with weekly revisit rates that can be used to measure retention.
It also provides deep analysis of data that average web analytical tools fail to provide, It has tools like cohort explorer that can foretell how much money a user would put in your application over the entire lifetime, just based on your user’s past behavior.
Advantages:
- Custom dashboards
- Unlimited data storage
- Marketing automation
- Free trial
- Growth factor measuring
Mixpanel
MixPanel is a fantastic tool that helps the application owner to understand his user’s behavior by tracking their actions.
It is not limited to just mobile applications but also offers web analytics solutions.
The features that make this tool powerful are funnel analysis, real-time data, in-depth analysis, and cohort analysis that can track user retention.
The tool also offers the advantage of linking mobile users and web users, which can help a product owner understand his website’s retention stats.
The owner can watch real-time events that happen in his application, and using the point and click interface; s/he can easily delve into mobile analytics data.
Around 39,870 companies use Mixpanel analytics, but the most famous ones are: Uber, Airbnb, OLX, Lyft, Intel Security, Stripe and Twitch.
Webtrends
Webtrends offers a vast range of solutions, amongst which is the widely preferred mobile measurements.
The tool provides analytics for both mobile applications as well as mobile websites. It offers real-time campaign reporting with intuitive dashboards and data visualization. The metrics provided by WebTrends are the next pages, heat maps, visits, real-time social metrics, countries, and traffic sources.
WebTrends provides mobile and web applications with information about session duration, screen view per session, revenue/downloads, new user acquisition, and the number of sessions.
This analytics tool is available for android, windows, and Blackberry phones.
Since it is used for both web apps and mobile apps, it may lack some features that tools made entirely for mobile applications may have.
Some famous organisations that rely on WebTrends are: AON, Audi, BMW,Canon, Coca Cola, Bupa, Dell, and British Council.
SmartLook
Smartlook is one of the most excellent analytics tools ever. It has a unique feature set through which you can easily look into your user journey and understand their behavior at a micro-level.
Some fantastic features provided by smartlook are:
- It includes user session recordings and replays
- It offers astounding filtering options & custom recording segmentation
- Click, Scroll and movement heatmaps
- You can share recordings
- It facilitates Automatic event tracking, points out Javascript errors & provides comprehensive events management
- Add custom events & properties for advanced evaluation through event breakdowns (advanced events segmentation)
- Defines conversion funnels with entire customer journey recordings
- Global data analysis overview through Dashboard & custom tiles
- The tool supports identification methods
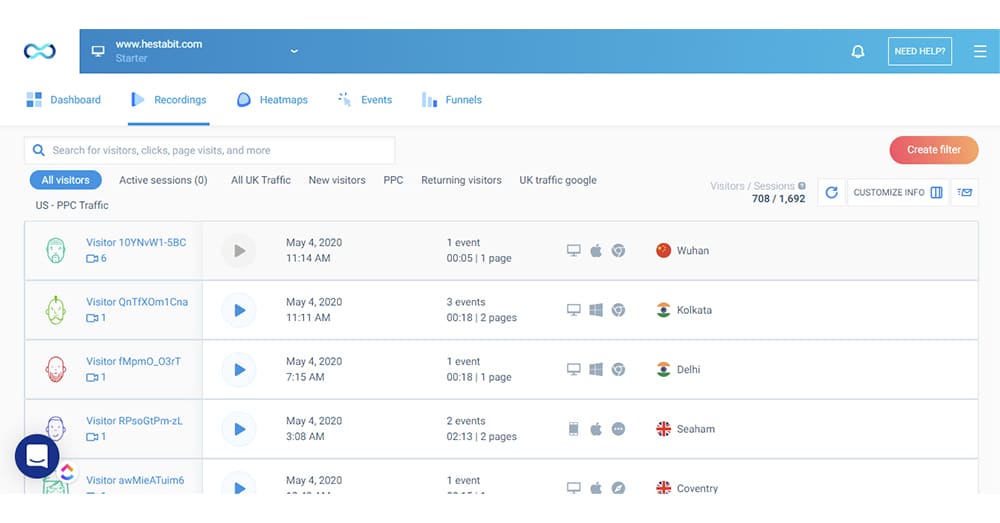
Always-on visitors recording provided by smartlook analytics show what every visitor on your website or application does, and the add on automatic event tracking gives your information on how exactly does your user do specific things. Using this tool, you can build conversion funnels to find out your conversion rates.
Features like heatmaps give you a massive amount of data through which you can know where your users’ click, scroll, stay and interact on your website.
If you use this analytics tool, you can have a good look at your user journey. Using that you can enhance the user experience, improve the quality of your website, smart tracking of visitors to know what they are doing on your app, how long they spend on your app/website and how long they stay, which pages they browse, where they click and which content hooks them.
Smartlook will provide you with user flow insights that’ll look something like this:
The tool is used by 250,000 users till now and the numbers are ever growing.
These tools are not just tried and tested, but there are thousands of product owners who use these tools to measure their development, to measure how close they have reached to their goals.
All these tools are equally efficient, but which tool would suit your product the best totally depends on your needs.
Choose the tool that lets you get in-depth knowledge about your user’s journey with your application. Keep in mind your needs and choose accordingly.
The right analytics tool would help you form a connection with your users, understand their needs better, and get instant feedback, which is very crucial to avoid any negative output later.
Choose the tool that matches your marketing needs and waste no time,
Get on with the hard work!